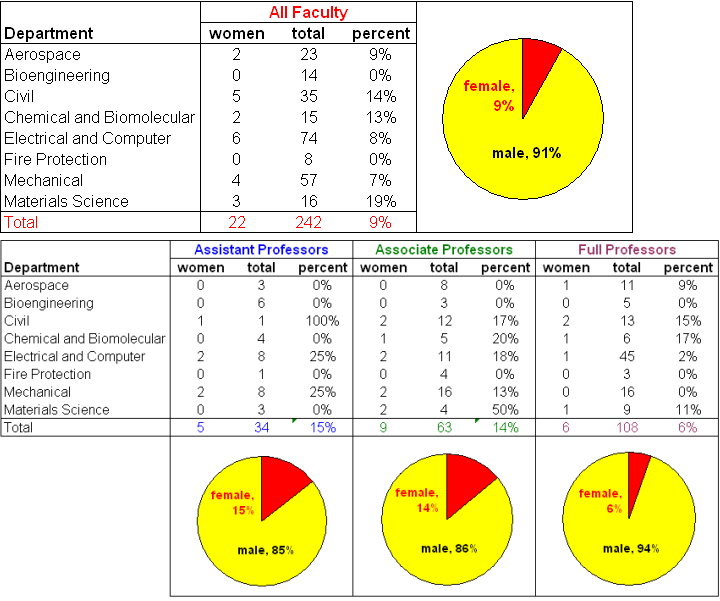
Statistics Concerning Women in Engineering at UMD The information on this page is correct to the best of my knowledge. Errors will happily be corrected upon notification. On this Page: These are the 2008 numbers. "All faculty" means all tenure or tenure-track faculty with primary appointments in Engineering, including emeritus.
Similar statistics are kept by the following organizations.
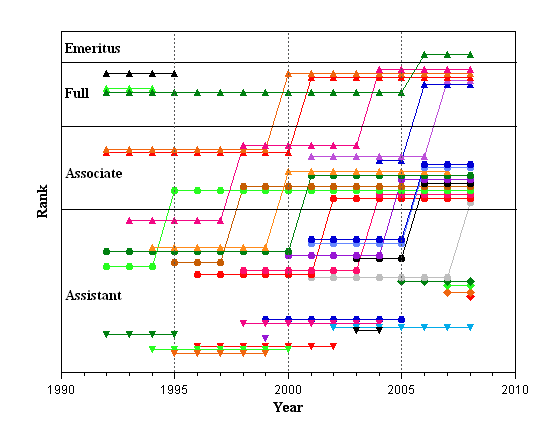
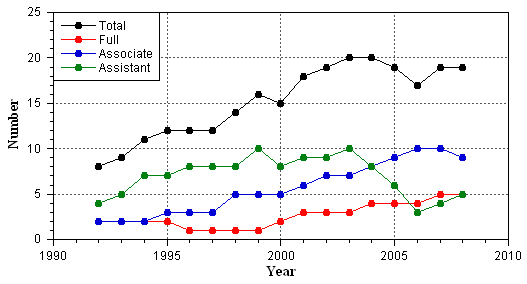
The plot below shows the ranks of the women professors over time, with data going back to 1992, at which time there were 8 women professors in the Clark School. Since 1992, one woman has been promoted from Assistant through to Full; the others promoted to Full Professors were either already Associates in 1992 (1999, 2000) or were hired as Associates (2005, 2006). With the exception of those Associate two hires, the other women who are now Associates were promoted from Assistant; on average approximately 1 has been promoted per year. There have been 13 promotions to tenure, and 7 denied tenure, so the “success” rate is approximately 2/3.
Up-pointing triangles mark those who are full professors (6 since 1992, 4 currently), and circles mark those who achieved associate rank (10 total in 2008). Down-pointing triangles indicate those who did not attain the rank of Associate (9), while diamonds indicate those who have not yet come up for tenure (4).
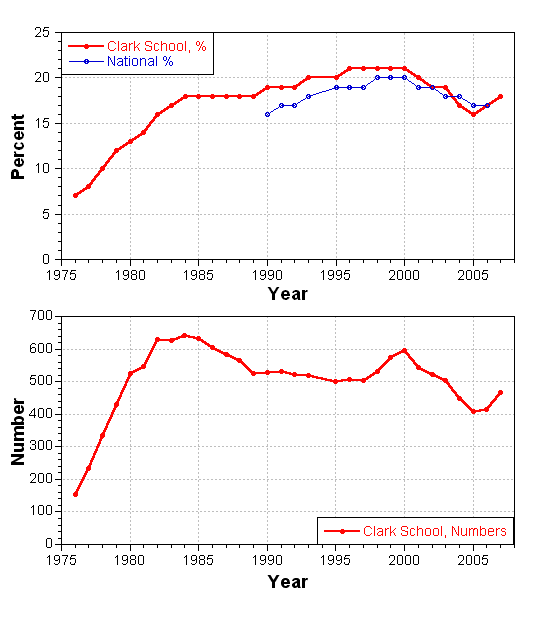
Women Undergraduates, Enrollment over Time The following plots show the percentage and number of women undergraduates enrolled full and part time in the Clark School through 2007, compared with national percentages. Large gains through the mid 1980s were followed by much smaller gains (percentage-wise, with losses numbers-wise) through 2000, and a drop since 2000.
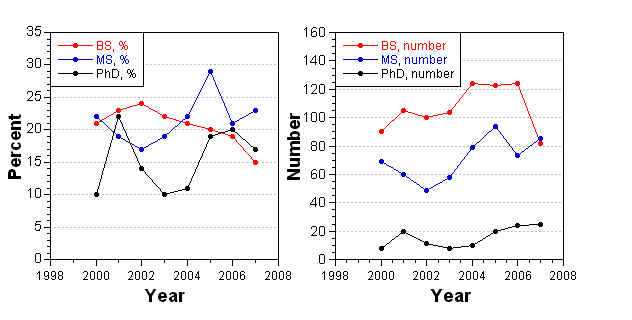
The following plots show the percentage and number of degrees awarded to women in the Clark School. The PhD percentages fluctuate due to the small totals. The numbers are not going up significantly.
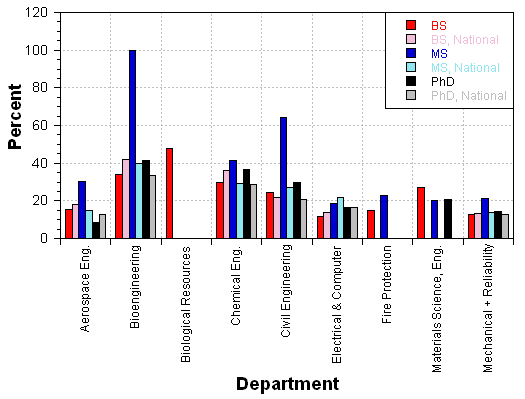
The following plots show the percentage of women enrolled in the various departments in the Clark School in 2007, full and part time, as well as the national percentages from 2006 (these data from WEPAN). Note that not all programs grant all three degrees, and that some departments are not commonly found nationally, so thatnot all columns contain data.
|
|
|
©2013